
Calendar spread options strategy
A calendar spread is a strategy used in options and futures trading: two positions are opened at the same time – one long, and the other short. Calendar spreads are also known as ‘time spreads’, ‘counter spreads’ and ‘horizontal spreads’.
The calendar spread offers the flexibility to utilize either ATM (at-the-money) strike prices, resulting in a directionally neutral trade, whereas OTM (out-of-the-money) strike prices introduce a directional element to the trade. The variation enables traders to lean into a bullish or bearish position, depending on your market outlook or risk appetite.
Elements of the Calendar Spread
How the calendar spread makes money?
The first way a calendar spread options strategy makes money is the theta (time decay). The idea is that the near term option is losing value much faster than the back month option. Sounds good, doesn't it? The problem is that the stock will not always act according to our plan. If the stock makes a significant move, the trade will start losing money. Why? Because if the stock moves up significantly, both options will have very little time value and the spread will shrink.
The second way a Calendar Trade makes money is with an increase in Implied Volatility in the far month option or a decrease in the volatility in the short term option. If there is a rise in volatility, the option will gain value and be worth more money. When implied volatility increases, it will usually increase more for the long term options since their vega is higher. The trade is vega positive which means it benefits from the increase in implied volatility.
Time Decay Trade
Options, as financial instruments, have a finite lifespan. The greater the time remaining until an option expires, the higher its time value. Consequently, options lose value with each passing day, which is why selling options is an essential tool in the option trader’s toolbox. The measure of this time decay is known as theta. Theta essentially measures how much value an option will lose each day.
However, the issue with selling options is the presence of unlimited risk. Given that a stock’s upside is theoretically infinite, selling a call option leaves you exposed to potentially unlimited losses.
A calendar spread capitalizes on time decay, also known as theta decay, while simultaneously hedging the unlimited risk by purchasing a longer-term option.
Market Neutral (Delta Neutral) Or Directional
The conventional approach to the calendar spread involves selling a short-dated at-the-money (ATM) call or put option and simultaneously buying a longer-dated ATM call or put.
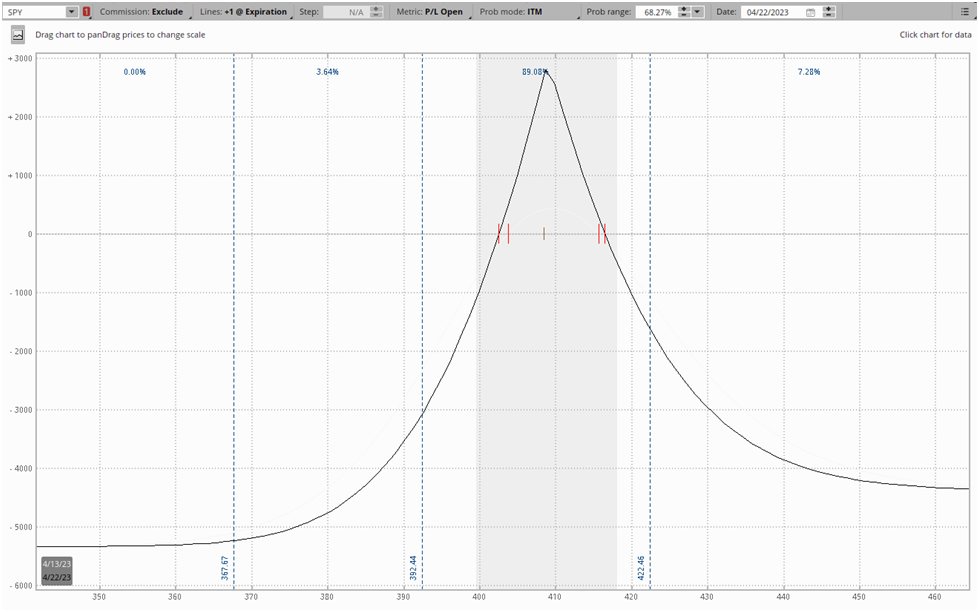
For instance, let’s consider an ATM calendar spread in SPY.
- SELL (1) SPY 21 APRIL $409 CALL @ $5.38
- BUY (1) SPY 19 MAY $409 CALL @ 10.72
- Net Debit: $5.34
By choosing ATM strike prices, we’re not overly concerned with which direction the underlying stock moves. Ideally, the stock barely moves and hovers around our strike price. However, because we chose call options for this spread, we have a slightly bullish directional bias, as you can see in payoff diagram below:
But, remember, the beauty of options trading is that it enables creativity. We can morph the “textbook” options spreads to match our market outlook or desired exposure. So for instance, if you wanted to take advantage of theta decay in a hedged manner but dial up your directional bias, you can achieve this by tweaking the strike prices of your options.
Let’s take a look at how altering the strike prices changes calendar spreads. First, we’ll look at an out-of-the-money (OTM) call calendar spread in SPY. We’ll use a 0.20 delta call option in the front month:
- SELL (1) SPY 28 APRIL $419 CALL @ 1.17
- BUY (1) SPY 19 MAY $419 CALL @ $4.19
- Net Debit: $3.02
Notice how the payoff of the trade dramatically shifts, while still maintaining the same cone shape:
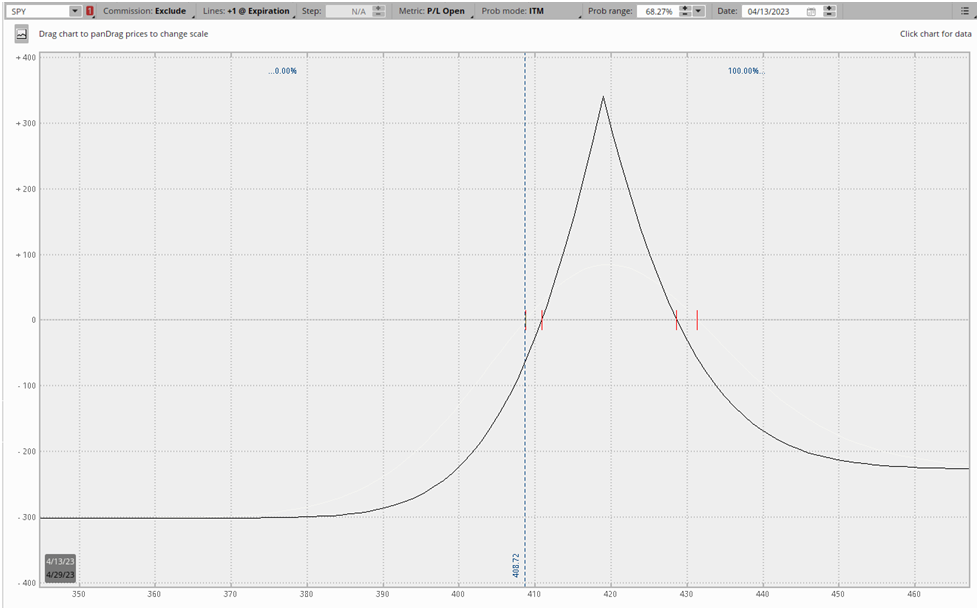
The blue dotted vertical line is the underlying spot price. Notice how the underlying stock needs to go up for the trade to make money, but not increase too much that your front-month option expires with intrinsic value.
You’ll notice that regardless of which strike price you pick, whether it’s in-the-money, out-of-the-money, or at-the-money, you’re still aiming for the stock to trade at or near the strike price when your front-month option expires.
Defined Risk Profile
You can’t lose more than your net debit in a calendar spread. Even though you’re short an option, its P&L is offset by owning a longer-dated option at the same strike price.
Limited Profit Potential
While the calendar spread offers a limited risk profile, it also comes with limited profit potential. Because you’re long and short calls at the same strike price, any upside in your long call will be offset by your short call.
It’s difficult to pinpoint exactly what the maximum profit of a calendar spread will be because it depends on the changes in implied volatility between the two expiration dates.
Net Long Premium (Net Debit)
The calendar spread operates as a net debit options strategy, meaning you pay a premium to enter the position. In other words, it means you’re net-long options.
This can be a point of confusion for the calendar spread. After all, the majority of theta decay strategies collect a net credit. But remember, between two options with the same strike price, the option with more time value will always cost more. Because we’re selling a short-dated option and buying a longer-term option, the calendar spread will always incur a net debit.
The net debit represents the maximum you can lose in the calendar spread.
The Calendar Spread is Vega Positive
A positive vega trade is the same as being “long volatility,” they’re just different ways to say the same thing. Because the calendar spread is a net debit strategy, it profits from increases in implied volatility (IV). This is because longer-dated options have more vega, so any losses as a result of increases in implied volatility will be more than offset by gains in your long-dated options.
However, this can work against you. If the increase in volatility is the result of a breakout or the start of a new trend, it can often mean that the price is moving up or down too much for your trade to be profitable at the expiration date. Remember, while calendar spreads are positive vega, ideally the stock trades around the strike price as the value of the front-month option slowly declines as a result of theta decay.
Calendar Spread Structure: How to Create a Calendar Spread
The core concept of a calendar spread involves selling a short-term option and buying a longer-dated option at the same strike price.
There’s a number of considerations involved when structuring a calendar spread. The most important comes down to your market view. Your opinion on what you think the market will do should drive which strike prices you choose, not the price of the spread.
The Choice of Strike Price: Calendar Spread Examples
You can boil down the choice of which strike price to use in a calendar spread to three basic types of calendar spreads:
- In-the-money (ITM) calendar spreads
- At-the-money (ATM) calendar spreads
- Out-of-the-money (OTM) calendar spreads
These differences shape the payoff profile of the trade, as well as the cost of entering the trade.
In-the-Money Calendar Spread Example
An in-the-money (ITM) calendar spread uses ITM options. For instance, if the underlying stock is trading at $410, you might use the $400 calls or $420 puts.
While ITM options on their own are expensive, ITM calendar spreads can be quite cheap compared to its ATM and OTM counterparts because ITM options have comparatively low extrinsic value, narrowing the difference between the short-dated and long-dated options.
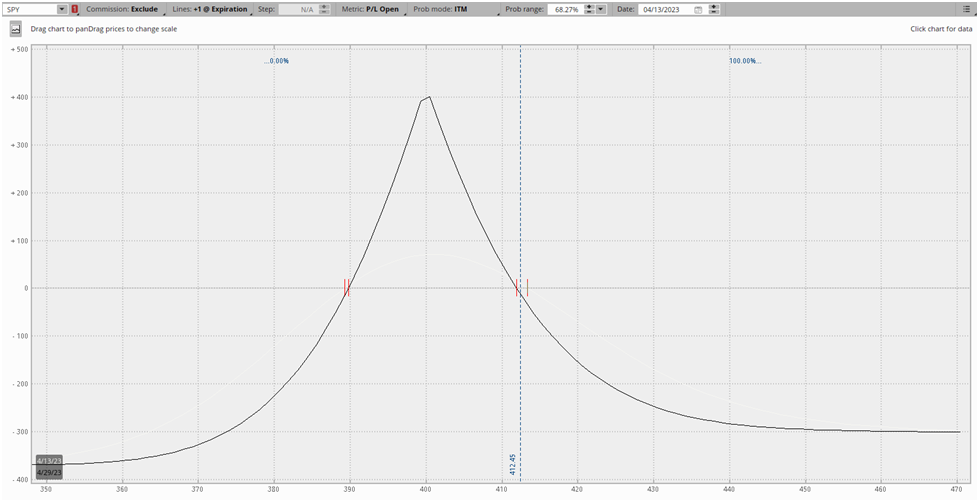
As a result of the lower price tag, the maximum profit of an ITM calendar spread is also lower than OTM and ATM spreads. Let’s take a quick look at one:
- SELL (1) SPY 28 APRIL $400 CALL @ 15.25
- BUY (1) SPY 19 MAY $400 CALL @ $18.90
- Net Debit: $3.65
Here’s the payoff diagram. Keep in mind that the blue dotted vertical line represents the underlying stock spot price:
At-the-Money Calendar Spread Example
At-the-money (ATM) calendar spreads are the most expensive type of calendar spread to enter, in terms of the net debit you have to pay to put the trade on. They're also the calendar spreads which have the smallest maximum profit level.
Let’s take a look at an example:
- SELL (1) SPY 28 APRIL $412 CALL @ 6.00
- BUY (1) SPY 19 MAY $412 CALL @ 10.25
- Net Debit: $4.25
Here’s a payoff diagram for this calendar spread:
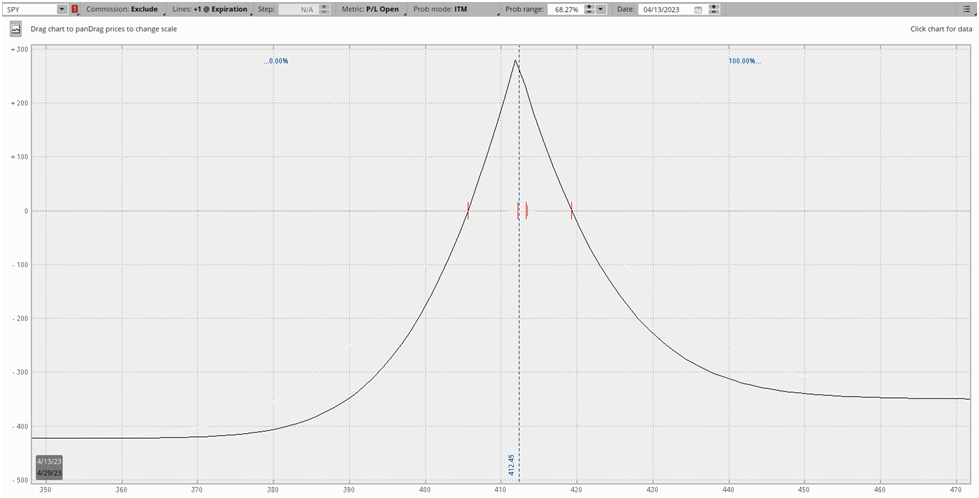
The blue dotted vertical line represents the underlying spot price. Notice how an at-the-money calendar spread reaches max profit if the underlying stock doesn’t move until the expiration date, resulting in the short-dated option expiring worthless.
Out-of-the-Money Calendar Spread Example
Out-of-the-money (OTM) calendar spreads require the market to move in your direction to make a profit. While calendar spreads are traditionally viewed as market-neutral plays on theta decay, you can also take a directional view by using OTM spreads. They also allow you to structure asymmetric reward/risk ratios.
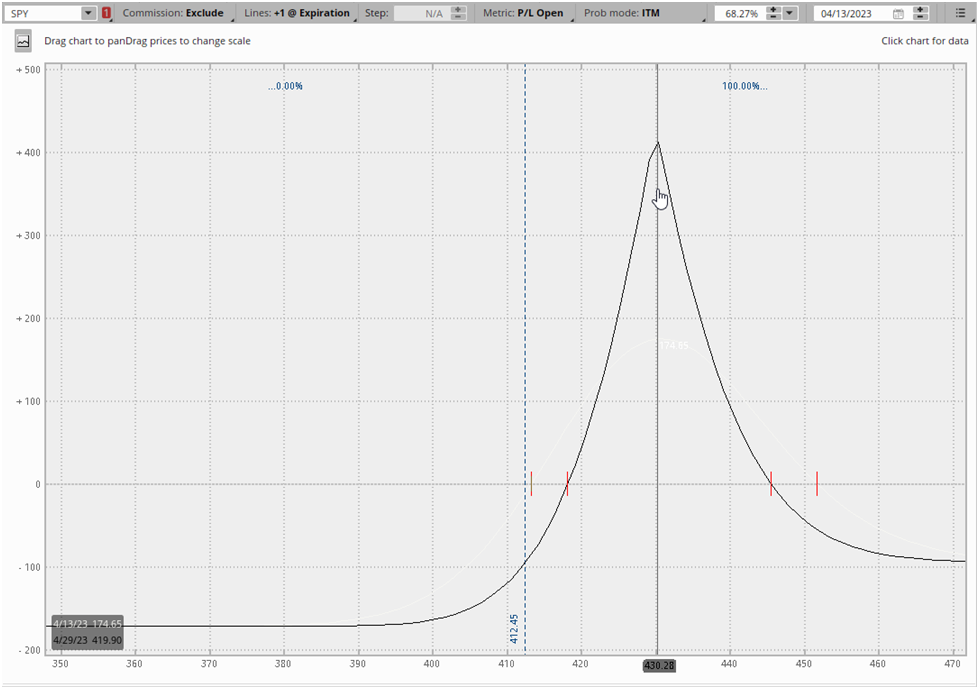
Let’s take a look at an example, with the underlying stock at $412.45:
- SELL (1) SPY 28 APRIL $430 CALL @
- BUY (1) SPY 19 MAY $430 CALL @
- Net Debit: $1.74
Here’s a payoff diagram:
Expirations
There are multiple things to consider when choosing the expiration dates to use in your calendar spread. Among them are:
-
The implied volatility (IV) of the front-month should be high relative to history. You can use metrics like Implied Volatility Rank to measure this
-
The implied volatility of the back-month should be low relative to history.
-
The wider the gap between expiration dates, the higher your net debit will be, as you’ll be paying up for the time value of the significantly longer-dated option.
The Choice of Puts vs. Calls
When it comes to at-the-money calendar spreads, there’s not a big practical difference between using puts or calls. Due to volatility skew, put options will often have slightly higher implied volatilities, however, this effect isn’t significant enough to put too much consideration into.
Calendar Spread Payoff and P&L
Calendar Spread Maximum Profit
Because you’re trading options in different expiration dates, it's not possible to precisely determine the maximum profit of a calendar spread. In other words, there’s no hard-and-fast rule to apply. The maximum profit differs from spread to spread.
However, you can get a very good idea of how the P&L of the trade will evolve by simply looking at a payoff diagram of a calendar spread in your options trading platform. Many SteadyOptions users use OptionNet Explorer, ThinkOrSwim, and other tools from leading tools.
For instance, let’s take a look at a simple ATM calendar spread in Apple (AAPL) stock:
- SELL (1) 19 May $165 Call @ $5.64
- BUY (1) 16 June $165 Call @ 7.72
- Net Debit: $2.10
Here’s a payoff diagram of this trade:
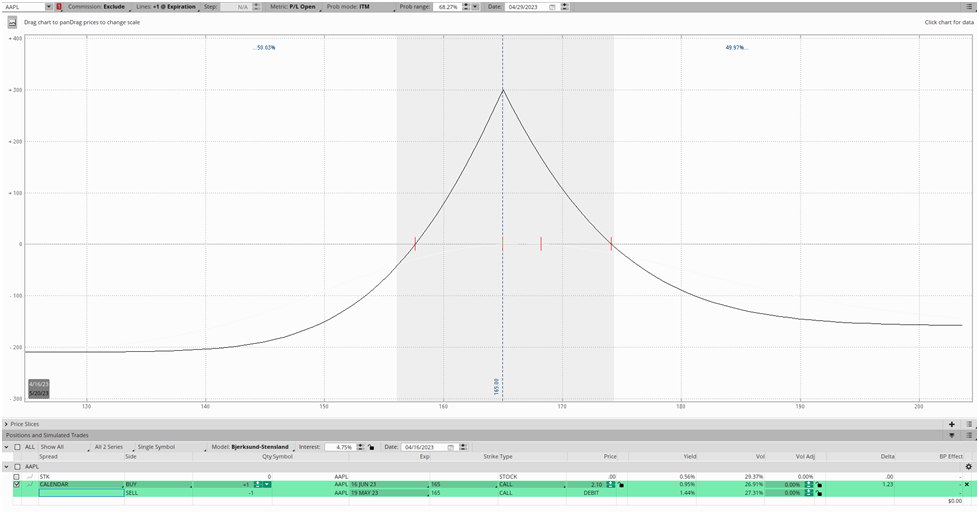
This is one of the most “standard” calendar spread trades, which sells an option with roughly 30 days to expiration (DTE), and buys one with about 60 DTE. As you can see, the maximum profit estimated by ThinkOrSwim is roughly $300. This can slightly vary based on how the IVs of each expiration change throughout the trade, but it’s a very close estimate.
Calendar Spread Maximum Loss/Risk
The maximum risk of a calendar spread is the net debit paid to enter the trade. Let’s go back to the Apple (AAPL) example we used in the previous section:
- SELL (1) 19 May $165 Call @ $5.64
- BUY (1) 16 June $165 Call @ 7.72
- Net Debit: $2.10
To calculate the net debit (or credit) of an options trade, you simply calculate the price difference of the options you want to buy and sell. In this case, we’re buying an option for $7.72 and selling one for $5.64, making the difference and our net debit $2.10. This is our maximum risk on the trade.
Calendar Spread Breakeven Prices
Because we’re trading options with different expiration dates, there’s not a precise breakeven calculation. We’re trading the interaction between the two expiration dates, meaning we’re betting that the front-month expiration will theta decay faster than the back-month option. However, because the option Greeks of different expirations evolve over time, there’s no way to know for sure before entering the trade what our breakeven price will be.
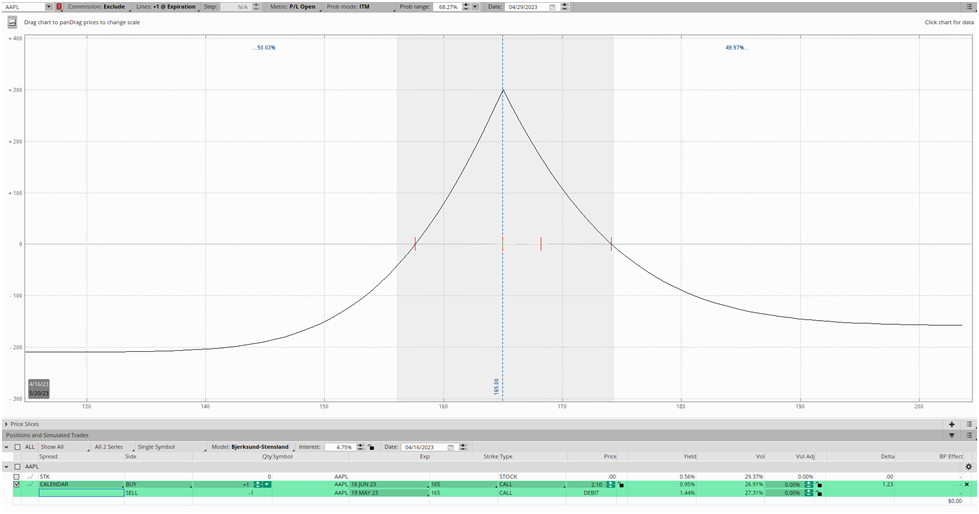
However, as said, the breakeven prices in an options trading platform are close enough. For instance, in our Apple trade from earlier, ThinkOrSwim gives us breakeven prices of $157.75 and $174.17. See the payoff diagram below:
Calendar Spread Market View
Why Matching Your Market View to Options Trade Structure is Crucial
One thing we're trying to nail home in this reverse straddle primer is the importance of matching your market view to the correct options spread. As an options trader, you're a carpenter, and option spreads are your tools. If you need to tighten a screw, you won't use a hammer but a screwdriver.
So before you add a new spread to your toolbox, it's crucial to understand the market view it expresses. One of the worst things you can do as an options trader is structure a trade that is out of harmony with your market outlook.
This mismatch is often on display with novice traders. Perhaps a meme stock like GameStop went from $10 to $400 in a few weeks. You're confident the price will revert to some historical mean, and you want to use options to express this view. Novice traders frequently only have outright puts and calls in their toolbox. Hence, they will use the proverbial hammer to tighten a screw in this situation.
In this hypothetical, a more experienced options trader might use a bear call spread, as it expresses a bearish directional view while also providing short-volatility exposure. But this trader can be infinitely creative with his trade structuring because he understands how to use options to express his market view appropriately.
The nuances of his view might drive him to add skew to the spread, turn it into a ratio spread, and so on.
What Market Outlook Does a Calendar Spread Express?
More than anything, the calendar spread is bearish on short-term implied volatility. A trader using a calendar spread is essentially betting that the front-month or short-dated option that they sell short will expire worthless. The back-month long option essentially serves mostly as a hedge.
Additional considerations
Can I be assigned on my short options?
If your short options become deep ITM, you can be assigned. If you have a call calendar spread, you will own the long calls and short the shares. If you have a put calendar spread, you will own the long puts and long the shares. In both cases, the long options will offset any gains or losses in the shares, so the final result would be similar to owning the calendar spread.
Assignment by itself is not a bad thing - unless it causes a margin call and forced liquidation. Worst case scenario, the broker will liquidate the shares in pre-market, the stock will rise between the liquidation and the open and the puts will be worth less. Otherwise, you are 100% covered - each dollar you lose in the stock you gain in the options.
You have two choices when it happens. First is just to let the short options to expire - since they are ITM, they will be exercised automatically, you will be short the shares and it will offset the long shares you were assigned. Second is just to sell the options and the stock at the same time. Both choices will produce a very similar result. You can ask the broker exercise the options as well, but this is like the first choice.
When and how to adjust?
Now, this is the key to successfully trading the calendar spreads. We will be very happy if the stock just continues trading near the strike price(s), but unfortunately, stocks don't always cooperate.
You need to have a plan before you place the trade. Look at the P/L graph. Identify the breakeven points at the expiration date. This is where I usually adjust.
The general idea is to keep the stock "under the tent". So if I started with a single calendar spread, I might open another one in the direction of the move. For example, if I opened the 145 calendar spread with the stock at 145, and the stock moved to 146, I might open the 147 calendar. This will double the original investment, so the alternative is to sell half of the 145 calendar and use the proceeds to buy the 147.
If I started with a double calendar spread, I might open the third one. For example, if I opened the 144/146 when the stock was at 145 and the stock moved to 147, I might add the 148, instead of 144 or in addition. Again, the idea is to move the tent and to balance the delta.
Directional or non-directional?
At SteadyOptions, we trade non-directional trading. So in most cases, we will want to be as delta neutral as possible. If the stock moves up, the trade will become delta negative. To reduce the deltas, we will adjust as described. However, sometimes I'm okay to be slightly delta directional to balance my other positions. So if the stock moved up and the trade became delta negative, but I have some other positions which are delta positive, I might give it some more room and wait with the adjustment. Of course I don't want to wait too long, otherwise the loss might become larger than I would like to allow.
Using OTM Directional Calendar Spreads provides a good explanation about directional calendar spreads.
General rules/guidelines when trading calendar spreads
- Always check the P/L graph before placing the trade. You can use your broker tools or some free software. I usually use the Optiionnet Explorer software to generate the graph.
- Avoid trading through dividends date.
- Avoid trading through major news like earnings announcements. The only exception to that rule is when you want to take advantage of the inflated IV of the front month, but those are highly speculative trades which might have a significant loss if the stock has a large post-earnings move.
- The front month options should expire in 5-7 weeks - unless you use weeklys which is usually more aggressive trade due to the gamma risk mentioned above.
- Have an exit plan before you enter the trade. My profit target is typically 20-30% and my mental stop loss is around 15-20%.
- Trade stocks which are in a trading range.
- Most of the time calendar spreads work better when IV is low. Those are vega positive trades which means they benefit from increase in IV.
- Aim for a long option near the low of its IV range. This gives it room to rise.
-
Avoid lower priced stocks - the trade will be too cheap and commissions consuming. As a rule of thumb, stocks under $50 usually are not suitable for calendar spreads. For example, if the trade costs $0.70, with $3 per spread round trip commissions the commissions will eat over 4% of the trade value, not including rolls. If the spread is $3, the commissions will be just 1%. Over time, it will make a huge difference.
Pre Earnings calendars
At SteadyOptions, one of our favorite strategies is pre-earnings calendars. This strategy takes advantage of special IV skew between long and short options. This strategy is among our most profitable strategies. We have used it with great success on stocks like GOOG, AMZN, NFLX, TSLA etc.
Pre-earnings calendars (or double calendars) use short options expiring few days after earnings. The idea is that for some stocks, the short term options will lose value faster than the longer term options, causing the calendars to widen. For those stocks, the IV increase of the short options just cannot keep with the negative theta, and the options lose value despite IV spike. For example, GOOG short term straddles/strangles were consistent losers due to the accelerating theta, so we are basically short those options and long options expiring 1-3 weeks later.
Bottom Line
The calendar spread is a strategy that capitalizes on theta decay while hedging out the unlimited risk of shorting options. With the suitability to use either calls or puts and tweak strike prices to reflect a directional market view, you can tailor it to fit your specific market outlook.
Related articles
- Why We Sell Our Calendars Before Earnings
- TSLA, LNKD, NFLX, GOOG: Thank You, See You Next Cycle
- Should You Add to A Losing Trade?
- Amazon Missed, And We Don't Care
- FANG Stocks Killed It. Again
- Using OTM Directional Calendar Spreads
Want to learn more about the calendar spread strategy and other strategies that we implement for our SteadyOptions portfolio?


There are no comments to display.
Create an account or sign in to comment
You need to be a member in order to leave a comment
Create an account
Sign up for a new account. It's easy and free!
Register a new account
Sign in
Already have an account? Sign in here.
Sign In Now